
Fully Loaded Labor Rate (Fully Burdened Rate): How to Calculate It in 2026
October 22, 2026


A fully loaded labor rate, also called a fully burdened labor rate, is what one hour of a worker really costs: wages plus payroll taxes, benefits and overhead, divided by the hours you get. In June 2026, US private employers spent $46.89 per hour worked on compensation, but only $32.82 of it was wages, according to the BLS employer compensation cost release (ECEC). Benefits added 42.9% on top of pay, before any laptop or manager time.
Below: the formula, 2026 payroll tax math, and a worked example for one US role at its BLS median wage, then a fair comparison with an all-in remote rate.
A fully loaded labor rate measures the employer-side cost of labor over a clearly defined hour. Start with pay, add every cost that exists because the seat exists, and divide by the hours that matter to your decision.
Fully loaded labor rate = (wages + employer payroll taxes + benefits + attributable overhead) ÷ hours
Two choices decide whether the number is useful:
Practical rule: label every labor rate with its cost boundary and its hours denominator. A rate without both is not comparable to anything.
For budgeting a seat, cost per paid hour is enough. For comparing sourcing options, cost per productive hour is the honest number. Like salary vs hourly pay, the pay model doesn't tell you how many useful hours you get.
| Term | What it usually means | Example from this guide |
|---|---|---|
| Fully loaded labor rate | Total cost per hour, all layers included | $28.99 per paid hour for the example rep |
| Fully burdened labor rate | Same as fully loaded in everyday use. In federal contracting, the cost rate after fringe, overhead and G&A, before fee | $60.38 in the wrap-rate example |
| Labor burden | The add-on cost over wages, in dollars or as a percent of wages | $14.07 an hour, or 42.9% of wages (BLS, June 2026) |
| Burdened labor rate / loaded labor rate | Shorter names for the total rate | Same as fully loaded |
| Wrap rate | The multiplier that turns a direct wage into a loaded rate | 2.0125 in the wrap example ($60.375 ÷ $30) |
Most searchers use these as synonyms. The nuance: in government contracting forums, practitioners separate a burdened cost rate from a billing rate that adds profit. If you price bids, keep profit outside the loaded cost so you don't count it twice.
The best public benchmark is the BLS Employer Costs for Employee Compensation (ECEC) series. It measures cost per hour worked, so paid leave shows up as a benefit, not as wages. The latest release, published September 9, 2026, covers June 2026.
| Measure (private industry) | June 2026 | December 2025 |
|---|---|---|
| Total compensation per hour worked | $46.89 | $46.15 |
| Wages and salaries | $32.82 | $32.36 |
| Benefits | $14.07 | $13.79 |
| Benefits as % of total compensation | 30.0% | 29.9% |
| Benefits as % of wages (burden on pay) | 42.9% | 42.6% |
| Total compensation ÷ wages | 1.43 | 1.43 |
Sources: the June 2026 ECEC release and, for December 2025, the BLS December compensation release published March 20, 2026 (also available as the Bureau of Labor Statistics compensation breakdown PDF). The two percentages answer different questions: 30.0% is benefits as a share of everything, 42.9% is what benefits add on top of each wage dollar ($14.07 ÷ $32.82).
Averages hide a lot. For office and administrative support jobs, where customer service reps sit, June 2026 wages were $25.22 an hour and benefits $11.51, so benefits added 45.6% to pay. That $11.51 breaks down into insurance ($4.05), paid leave ($2.77), legally required benefits ($2.58), supplemental pay ($1.06) and retirement ($1.05).
Build the numerator from your own records, not a blanket multiplier.
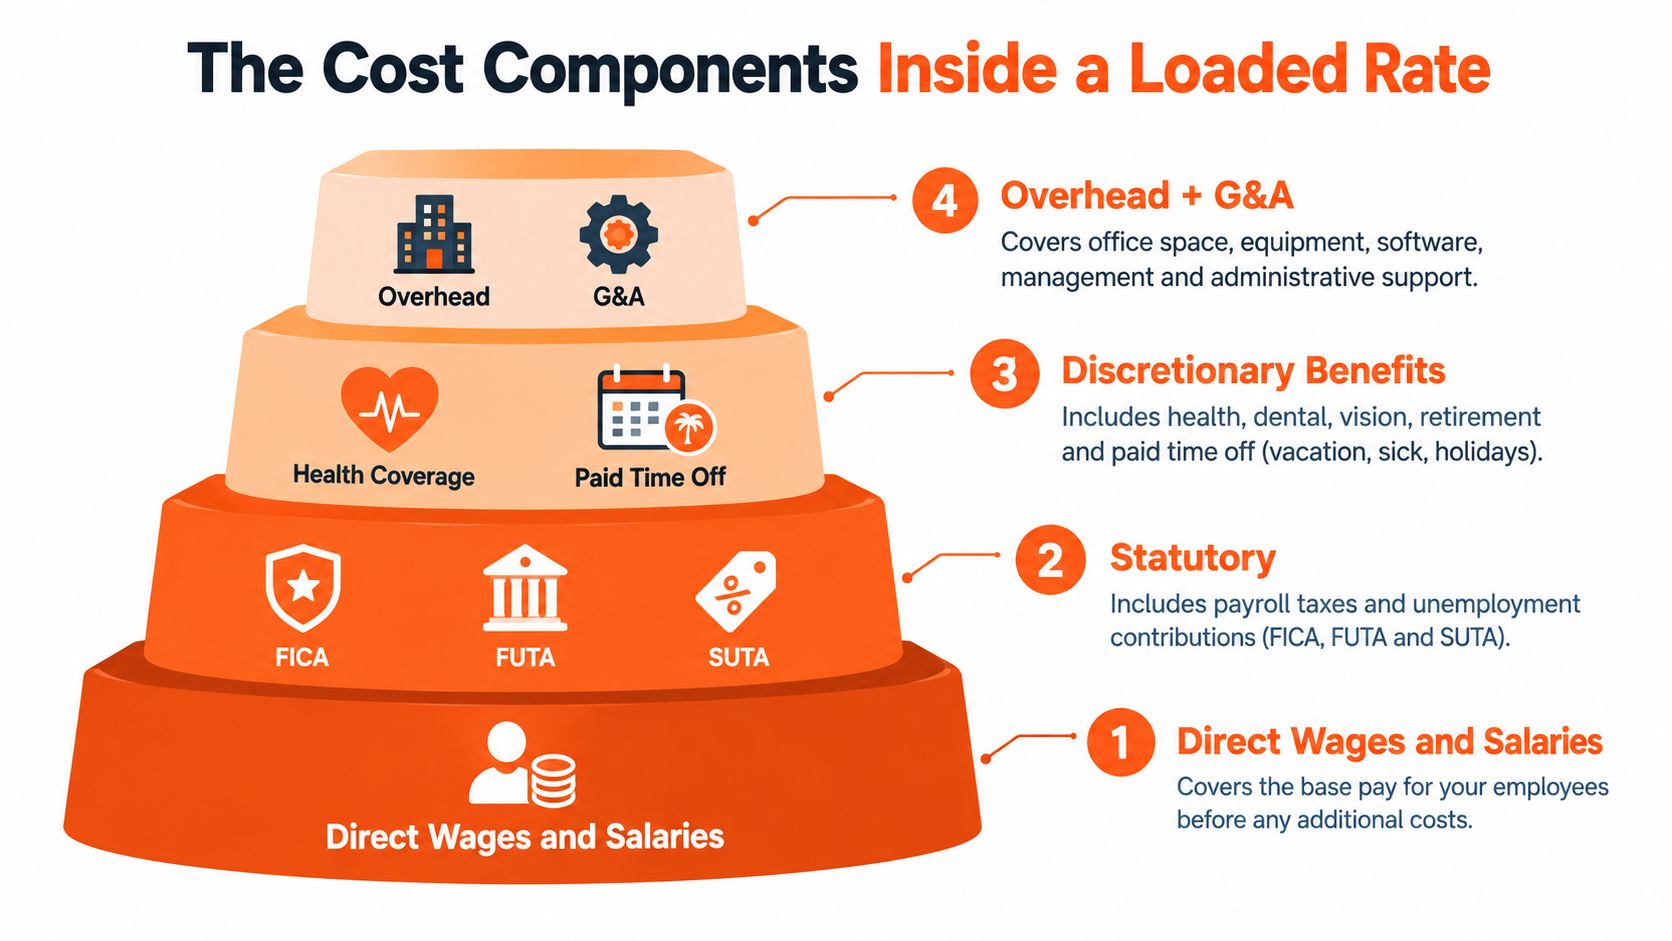
For a plain-language line between pay and perks, Benely's employee compensation explained post offers a simple test: if the worker pays tax on it, it is probably compensation; if not, it is probably a benefit.
Method 1: total cost ÷ hours. Add up one year of wages, employer taxes, benefits and attributable overhead, then divide by your chosen hours. Easiest to audit without formal cost pools; the worked example below uses it.
Method 2: the wrap rate. Apply indirect-cost factors to the direct wage. When each factor is calculated on a base that already includes the previous one, they compound:
Fully burdened rate = direct wage × fringe factor × overhead factor × G&A factor
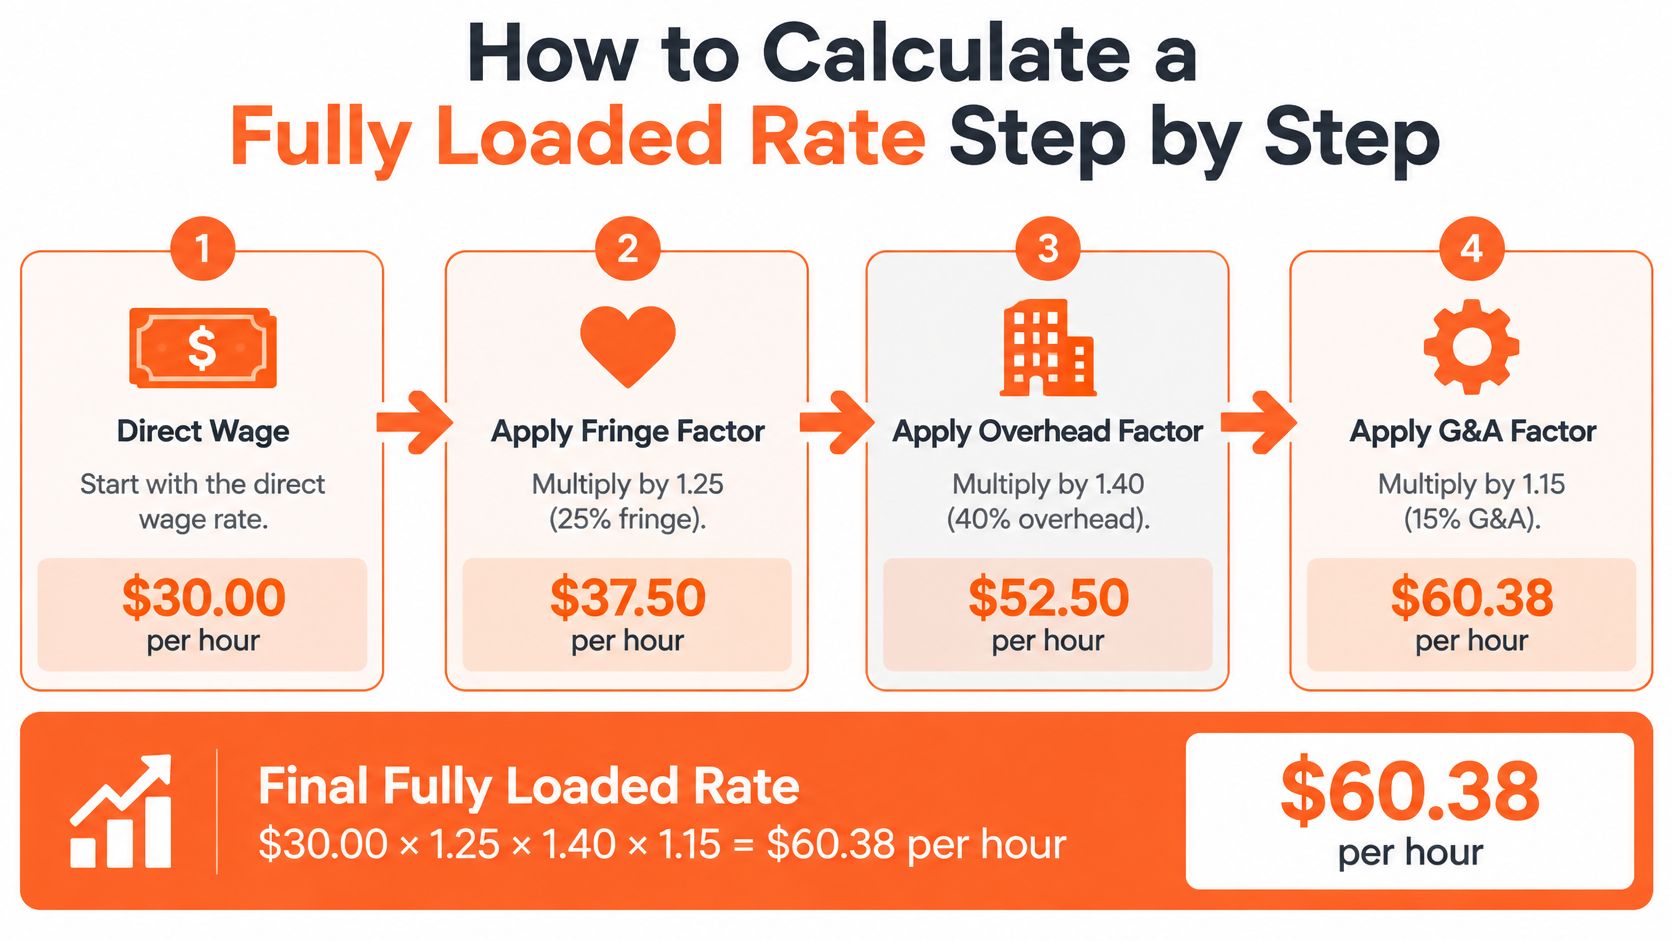
With illustrative factors of 25% fringe, 40% overhead and 15% G&A on a $30 wage: $30 × 1.25 = $37.50; × 1.40 = $52.50; × 1.15 = $60.375, or $60.38 an hour. If instead all three percentages apply to the wage alone, you add them: $30 × (1 + 0.25 + 0.40 + 0.15) = $30 × 1.80 = $54.00. The $6.38 gap is entirely about which base each factor uses.
Keep profit outside an internal loaded cost, and don't add profit or overhead to a vendor's all-in quote; the vendor already priced its own.
Give payroll taxes their own lines: each has its own rate and wage base, and a flat percentage breaks for earners above the Social Security cap.
For 2026, the IRS employer tax guide (Publication 15) sets employer Social Security at 6.2% up to a $184,500 wage base and Medicare at 1.45% with no wage base limit, so 7.65% on wages under the cap. The IRS FUTA topic page puts FUTA at 6.0% on the first $7,000 paid to each worker, with a credit of up to 5.4% for state unemployment paid on time, which leaves 0.6% if you qualify for the full credit and your state isn't a credit reduction state.
For an illustrative $70,000 salary, with all wages covered and the full FUTA credit:
| Employer tax | Calculation | Annual cost |
|---|---|---|
| Social Security | $70,000 × 6.2% | $4,340 |
| Medicare | $70,000 × 1.45% | $1,015 |
| FUTA after full credit | $7,000 × 0.6% | $42 |
| Federal employer subtotal | Sum | $5,397 |
That subtotal is 7.7% of the salary, and it is not the full statutory load. State unemployment and workers' compensation vary by state, industry and claims history, so pull your own rates. Tax withheld from the worker's pay is not an extra employer cost.
Wage-and-hour rules change the numerator too. Under the FLSA, most non-exempt workers must be paid 1.5 times their regular rate for hours over 40 in a workweek, and a salary alone doesn't make someone exempt, as one Mississippi employment firm's overview of flsa overtime rules puts it.
The denominator moves the answer more than most cost lines. A conventional budget assumes 2,080 paid hours a year for full time (40 × 52).
Paid leave is where double counting happens. If the annual salary already includes pay during leave, keep it in the numerator and take the leave hours out of the denominator. Don't also add a separate "PTO cost."
Some industries sidestep the problem by paying only for delivered units. Tutoring software, for example, turns completed lessons into teacher payouts; Tutorbase's page on how to calculate instructor pay correctly shows the per-lesson model (24 lessons × $45 an hour = $1,080). Per-unit pay shifts utilization risk to the worker; hourly and salaried pay leaves it with you.
Using the $60.375 wrap-rate example, here is how the effective rate rises as productive utilization falls. This is calculated sensitivity, not an observed benchmark.
| Productive utilization | Effective hourly rate | Increase vs 100% |
|---|---|---|
| 100% | $60.38 | 0% |
| 85% | $71.03 | 17.6% |
| 80% | $75.47 | 25.0% |
| 75% | $80.50 | 33.3% |
Apply the adjustment once. If your starting rate already uses productive hours, dividing by utilization again overstates cost. Use the same assumption for every option you compare.
The Loaded-Hour Ladder is the method we use when a buyer asks what a US hire "really" costs per hour. Each rung adds one layer with its source; inputs labeled example are illustrations to replace with yours. The example role is a full-time customer service representative at the national median wage of $21.53 an hour (May 2025), per the BLS Occupational Outlook Handbook.
| Rung | What it adds | Math | Annual | Per paid hour |
|---|---|---|---|---|
| 1. Wage | BLS median, customer service reps | $21.53 × 2,080 hours | $44,782 | $21.53 |
| 2. Statutory (federal) | Social Security + Medicare 7.65%; FUTA $42 (IRS, 2026) | $44,782.40 × 7.65% + $42 | $3,468 | $1.67 |
| 3. Benefits | Insurance + retirement = 20.2% of wages, office and administrative support (BLS ECEC, June 2026: $5.10 ÷ $25.22) | $44,782.40 × 20.2% | $9,056 | $4.35 |
| 4. Overhead and tools | Example: laptop, software seats, share of supervision | Example input | $3,000 | $1.44 |
| Loaded annual cost | Rungs 1 to 4 | $60,306 | $28.99 | |
| 5. Worked hours | Example: 160 hours of paid leave and holidays | $60,306 ÷ 1,920 hours | $31.41 per worked hour | |
| 6. Productive hours | Example: 85% of worked hours on the defined output | $60,306 ÷ 1,632 hours | $36.95 per productive hour |
Rung 3 leaves out ECEC's paid-leave line (handled in rung 5) and its "legally required" line (rung 2 covers federal taxes). State unemployment and workers' compensation are not included, so the result is conservative. And the US hire ends up at 1.35 times the wage per paid hour and 1.72 times the wage per productive hour; most of that second jump comes from the denominator, not the numerator.
The 2,080-hour default assumes every seat is full time. Our pipeline says that fails about half the time.
First-party data, Virtustant recruiting system (Sieve). Of 125 client searches opened between October 1 and October 21, 2026, 61 were part-time and 64 were full-time. 91 stated an hours count (for example, "20 hrs/wk"); 34 gave only a time window.
Method: searches pulled by role-family title (assistant, sales, customer, manager, specialist, coordinator, appointment setter, bookkeeper, developer, legal, operations and others) and deduplicated by record. Excluded: 13 of Virtustant's own evergreen postings and 1 duplicate search. Part-time = under 35 hours a week, labeled part-time, or a daily window of six hours or less. Counts only; no budgets or pay data.
Why it matters: a 20-hour role has 1,040 paid hours a year, not 2,080. Any fixed cost spread over those hours doubles per hour. The ladder's $3,000 example overhead is $1.44 per paid hour at full time and $2.88 at 20 hours a week. If you divide a part-time seat's costs by full-time hours, your loaded rate looks cheaper than it is.
An all-in hourly invoice is a fair comparison point, as long as you compare it with a US loaded hour, not a US wage, on the same denominator.
Virtustant prices customer service reps from $7/hr all-in. That is the whole invoice line for the hour. How the money splits is simple: if you pay your agent $10/hr, we give them $9 and keep the dollar in the middle. The rate is a vendor invoice, not a US payroll run, so the statutory and benefits rungs of the ladder don't appear as separate lines on your side. Confirm the treatment for your business with your accountant.
Put both on the same basis. At the same 85% example utilization, $7 ÷ 0.85 = $8.24 per productive hour, against $36.95 for the US example. A full-time year of invoiced hours at the starting price is $7 × 2,080 = $14,560, against a $60,306 loaded US cost. Add what you keep either way: software seats, supervision and training.
This is where Virtustant's "save up to 70%" comes from: the $7/hr starting price against a comparable US wage, and it holds against any US wage of $23.33 an hour or more ($7 ÷ 0.30). At the $21.53 customer service median, the wage gap alone is $14.53 an hour, before a single rung of load.
What each side carries, at a glance:
| Cost layer | US in-house hire | All-in remote rate: what to verify |
|---|---|---|
| Pay for the hour | You pay wages directly | Inside the hourly rate |
| US payroll taxes (FICA, FUTA, state unemployment) | You calculate and fund them | Not a line on a vendor invoice; ask your accountant how to treat the spend |
| Insurance and retirement plans | Per your plan design | Ask what the rate includes on the professional's side |
| Recruiting | You fund ads, screening and interview time | Check for placement fees and what a replacement costs |
| Tools and supervision | You provide them | Usually still yours; add them to the remote side too |
| Hours billed | Paid hours, including leave | Ask how absences and holidays are invoiced |
Starting prices are floors, not typical rates. For typical rates across a cohort, the H1 2026 rate report covers 441 placement starts from January to June 2026. The median client-side rate was $9.65/hr for customer service reps (n=9) and $10.83/hr for customer service (n=12). Across roles, medians range from $9.00/hr (dispatcher) to $12.41/hr (SDR/BDR). At $9.65, the productive-hour figure is $9.65 ÷ 0.85 = $11.35.
Use role pages to check scope before you compare. The customer service rep role page lists the starting price; see also the full list of roles and the virtual assistant page. For other models, see what a virtual assistant costs by model, what bookkeeping costs by model, and the six options in remote workforce models for SMBs.
Some costs are uncertain rather than recurring: a misclassified contractor, an overtime claim, a vacancy that leaves the work undone. They still belong in a decision model, as an expected value:
Expected hourly risk cost = annual probability × net financial impact you would keep ÷ productive hours
Only use it if you can defend the inputs with your own history or qualified advice. Otherwise keep a written risk register with scenarios instead of inventing a probability.
Paying someone to run a process is not proof they carry the consequences of getting it wrong. Ask who prepares the paperwork, who fixes payroll errors on the professional's side, what the replacement terms cover, and what stays with you. The payroll guide for founders is a useful checklist before you sign.
A loaded rate is a maintained calculation, not a permanent multiplier, because its layers move at different speeds. In the 12 months ending June 2026, civilian compensation costs rose 3.4%, wages 3.2% and benefit costs 3.8%, per the BLS Employment Cost Index release of July 31, 2026. Six months earlier, the Employment Cost Index summary for the year ending December 2025 showed 3.4%, 3.3% and 3.4%. Benefits are now outrunning wages, which pushes the burden percentage up even when pay holds steady.
Refresh the model yearly and whenever pay, the benefits plan or contract terms change, and keep a downside case with lower utilization. BLS publishes the next ECI on October 30, 2026 and the next ECEC, for September 2026 data, on December 16, 2026.
A fully loaded labor rate is the total hourly cost of a worker to the business: wages plus payroll taxes, benefits and the overhead that seat consumes, divided by a stated number of hours. It is also called a fully burdened labor rate. Always say which hours you divided by, because paid, worked and productive hours give very different answers.
For most buyers, yes. Fully loaded, fully burdened and loaded labor rate all mean wage plus the costs that ride on it. In federal contracting the terms are used more precisely: the burdened cost rate stacks fringe, overhead and G&A, and a billing rate adds fee or profit on top. Labor burden usually means the add-on itself, not the total.
Add up one year of wages, employer payroll taxes, benefits and attributable overhead, then divide by the hours you plan around. Or apply factors to the wage in the order your accounting uses them: $30 x 1.25 fringe x 1.40 overhead x 1.15 G&A = $60.38 an hour, while adding the same percentages to the wage gives $54.00.
In the BLS ECEC release for June 2026, private employers paid $14.07 an hour in benefits on top of $32.82 in wages, so benefits added 42.9% to wages and made up 30.0% of total compensation. For office and administrative support jobs, benefits added 45.6% to wages. Overhead and tools come on top of that.
US private employers averaged $46.89 per hour worked in total compensation in June 2026, per the BLS. For a single role, build it up: in this guide's example, a customer service rep at the BLS median wage of $21.53 costs $28.99 per paid hour and $36.95 per productive hour once taxes, benefits, example overhead and example utilization are included.
Pick one. If the annual salary already includes pay for vacation and holidays, leave that pay in the numerator and remove the leave hours from the denominator. Adding leave pay as a separate cost and also shrinking the hours counts it twice.
Not all of them. For 2026, IRS Publication 15 sets employer Social Security at 6.2% up to a $184,500 wage base and Medicare at 1.45% with no cap. FUTA is 6.0% on the first $7,000 per worker, and the state credit of up to 5.4% usually brings it to 0.6%, or $42 a year. State unemployment rates and wage bases vary.
Put both on the same productive-hour basis. Virtustant prices customer service reps from $7 an hour all-in, which is $8.24 per productive hour at the same 85% utilization used for the US example. Then add the costs you keep on either side, such as software seats and your own supervision time.
Virtustant is a remote staffing agency. After the hire, your account manager is your main point of contact and coordinates onboarding, the start date, tools access and the first-week plan, then follows up during the first weeks. You direct the day-to-day work. Virtustant handles payroll, paperwork and everything administrative on the professional's side. Terms: zero placement fees, a lifetime replacement guarantee, month-to-month, and one weekly invoice per placement. Shortlist in 48 hours. Start in 72 hours. See Virtustant pricing and book a discovery call with your role and the hours you need.
This guide is general information, not tax, legal or accounting advice. Rates and wage bases change; confirm your figures with a qualified professional.

