Managing Customer Services: A Practical Playbook
September 6, 2026


Managing customer service is a continuity problem before it is a metrics problem. Most playbooks open with CSAT and average handle time. But a dashboard measures a team, and in this function the team is the variable that keeps changing.
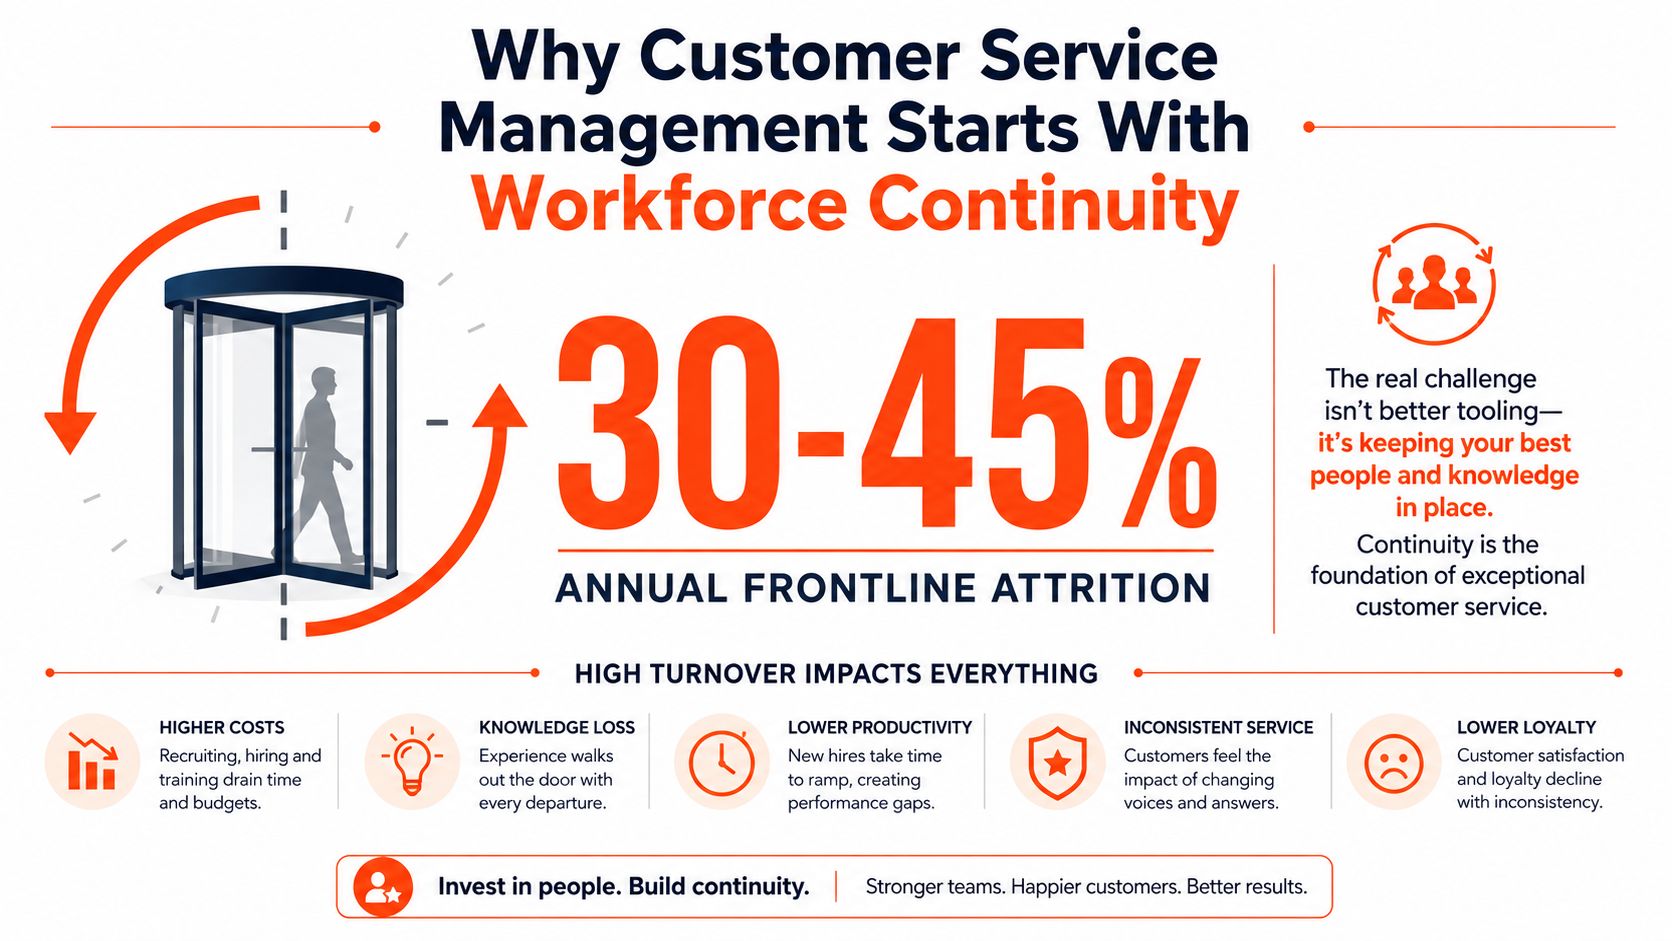
industry data on customer service turnover puts annual turnover in customer service roles at 30% to 45%, with the average call-center agent staying 14.3 months and customer support specifically 13.7 months. On a 20-person team that is six to nine people replaced a year, each one taking their accumulated context with them.
That is the frame for everything below: a four-stage operating model, the metrics that actually predict performance, a tiered workflow, a QA loop that produces coaching rather than scores, where AI genuinely fits, and how a staffing model either compounds the churn problem or contains it.
Every service problem a manager gets asked to fix, inconsistent answers, slow resolution, escalations that should not have escalated, traces back to the same root: the person handling the contact has been doing the job for under a year.
The customer service turnover analysis is worth reading with your own numbers next to it. At 30% to 45% annual turnover, a team never reaches steady state. Onboarding is permanent, your best agents spend their time answering colleagues instead of customers, and every process improvement has to be taught to a partly new team.
Retention initiatives help, and our guide to keeping top talent engaged covers what actually moves them. But no perk fixes a role that is structurally high-churn. What changes the arithmetic is how you staff it:
Model your own cost of a departure before you decide what to spend on preventing one: recruiting, the ramp weeks at partial productivity, the supervisor hours absorbed, and the quality dip while the seat is empty.
Every service organization runs the same four stages whether or not it has named them. Naming them is what lets you fix one without breaking another.
| Stage | What it owns | The failure you see when it breaks |
|---|---|---|
| Intake | Capture, identify, categorize and route the contact | Misrouted tickets and customers repeating themselves |
| Triage | Decide tier, urgency and owner against written rules | Everything becomes urgent, or nothing does |
| Resolution | Do the work, or escalate with full context | Long resolution times and repeat contacts on the same issue |
| Feedback | Close the loop into product, QA, docs and success | The same issue generating tickets six months later |
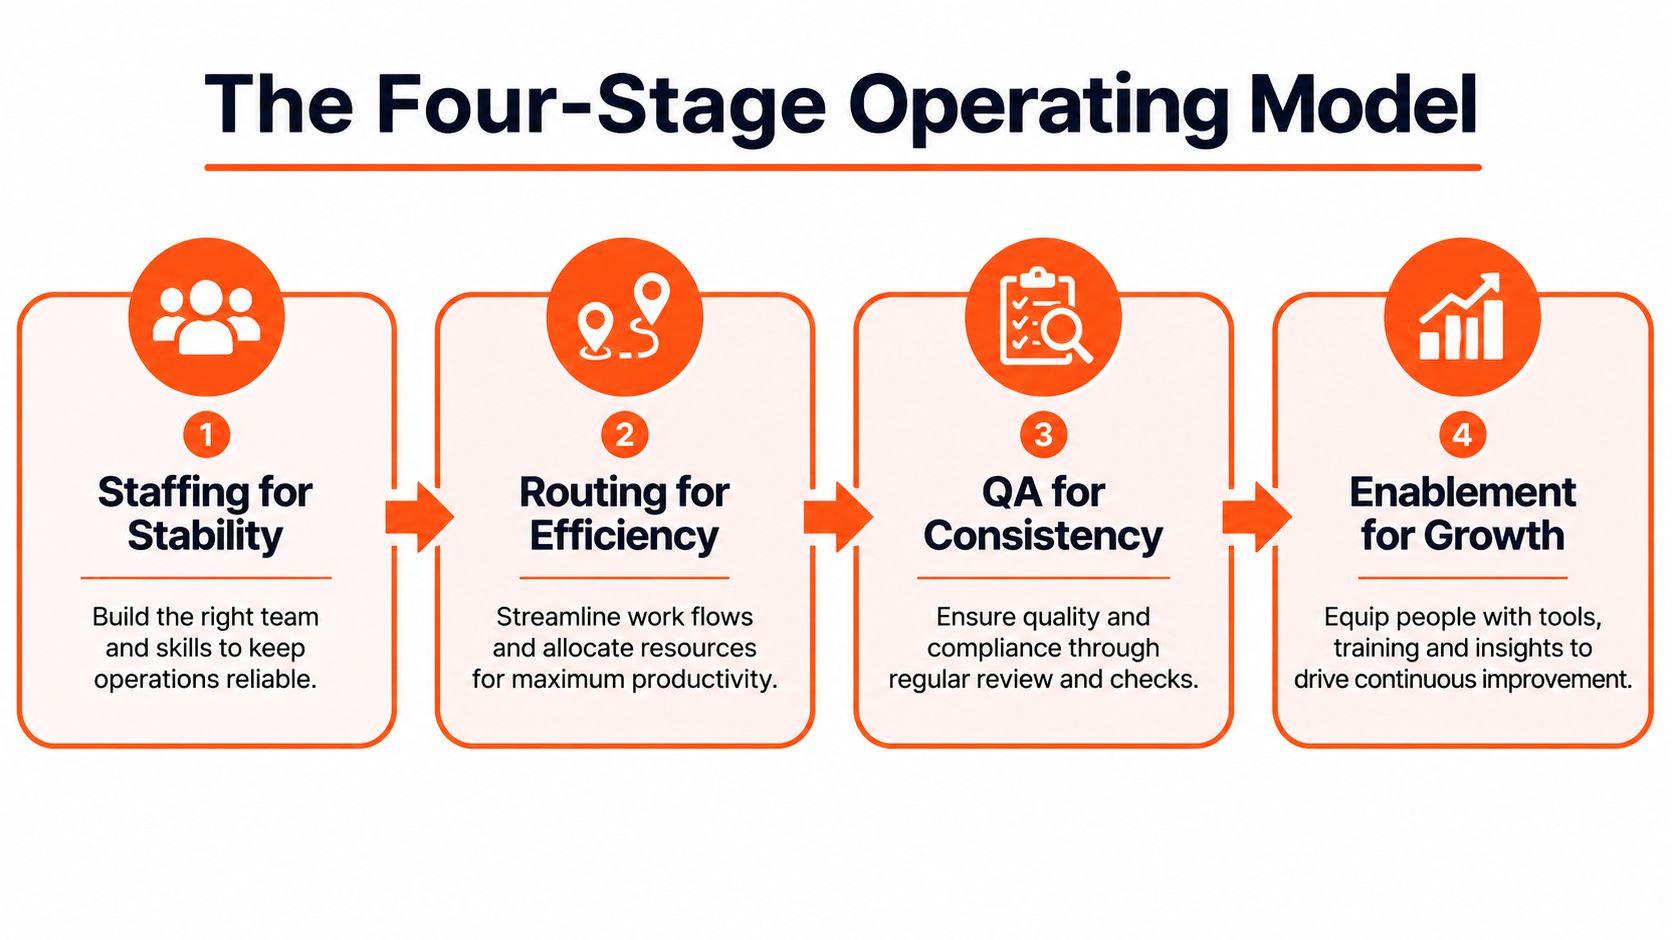
Most teams are strong at resolution and weak at intake and feedback. That is why the queue never gets shorter: nothing upstream stops the contact from being created, and nothing downstream stops it recurring.
Service and customer success fail at the same seam. If you are developing a success strategy, define ownership rules for service-generated churn signals, escalation feedback and recurring product friction. Customer success should not receive a vague list of unhappy accounts. It should receive a documented reason, the customer impact, the current owner and the next action.
A dashboard can be full of numbers and still hide the operating problem. Choose measures that identify service defects, expose workforce strain, and point a manager toward a specific change. None of them should become a standalone agent leaderboard.
| Metric | What it measures | Benchmark | What distorts it |
|---|---|---|---|
| CSAT | Customer sentiment after an interaction | Directional only, not a target | Low response rates and selective respondents |
| FCR | Resolution at the first eligible interaction | Industry average 71%; good is 70% to 79%; world-class is 80% or higher | Counting transfers and reopens inconsistently |
| First response time | Speed of the first human or automated reply | Under a minute for chat, under an hour for email | Auto-acknowledgements counted as responses |
| Resolution time | Time to close the issue | No single useful number, segment by issue type | Blending a password reset with a billing dispute |
| Backlog age | Share of open tickets going stale | Under 5% older than seven days | Bulk-closing old tickets to clean the number |
| Escalation and recontact rate | Whether the first answer held | Trend it against your own baseline | Rewarding closure speed over correctness |
On FCR, SQM Group's FCR guidance sets the benchmark average at 71%, with 70% to 79% as a good rate and 80% or higher as world-class. Use those as a directional target and define what counts as a resolution before you measure anything, because most FCR disagreements are definition disagreements.
On speed, Kayako's customer support metrics guidance places first response at under a minute for chat and under an hour for email, and holds backlog at under 5% older than seven days. Notably, it declines to give a single resolution-time benchmark on the grounds that resolution varies too much by issue type for one number to be useful. That refusal is the most useful thing on the page. A blended average resolution time mixes a two-minute password reset with a two-week billing dispute and tells you nothing you can act on. Segment by issue type or do not report it.
A falling FCR is usually a knowledge-base or permissions problem, not an effort problem. Before a coaching conversation, check whether the agent had the information, the authority and the tool access to resolve it on the first contact. Our guide to Build performance dashboards covers making these visible weekly rather than at month end.
Tiering is not a hierarchy of people. It is a set of written rules about which contacts stop where.
| Tier | Handles | Escalates when |
|---|---|---|
| Tier 0, self-service | Password resets, order status, policy questions, returns initiation | The customer has tried twice and failed |
| Tier 1 | Scripted and documented resolutions, account changes within limits | The fix is not in the playbook, or the customer is at risk |
| Tier 2 | Judgment calls, exceptions, technical diagnosis, goodwill within a written limit | Legal, security, refunds above the limit, or a strategic account |
| Owner | Policy exceptions, refunds above the limit, anything with contractual exposure | Never. This is where it stops |
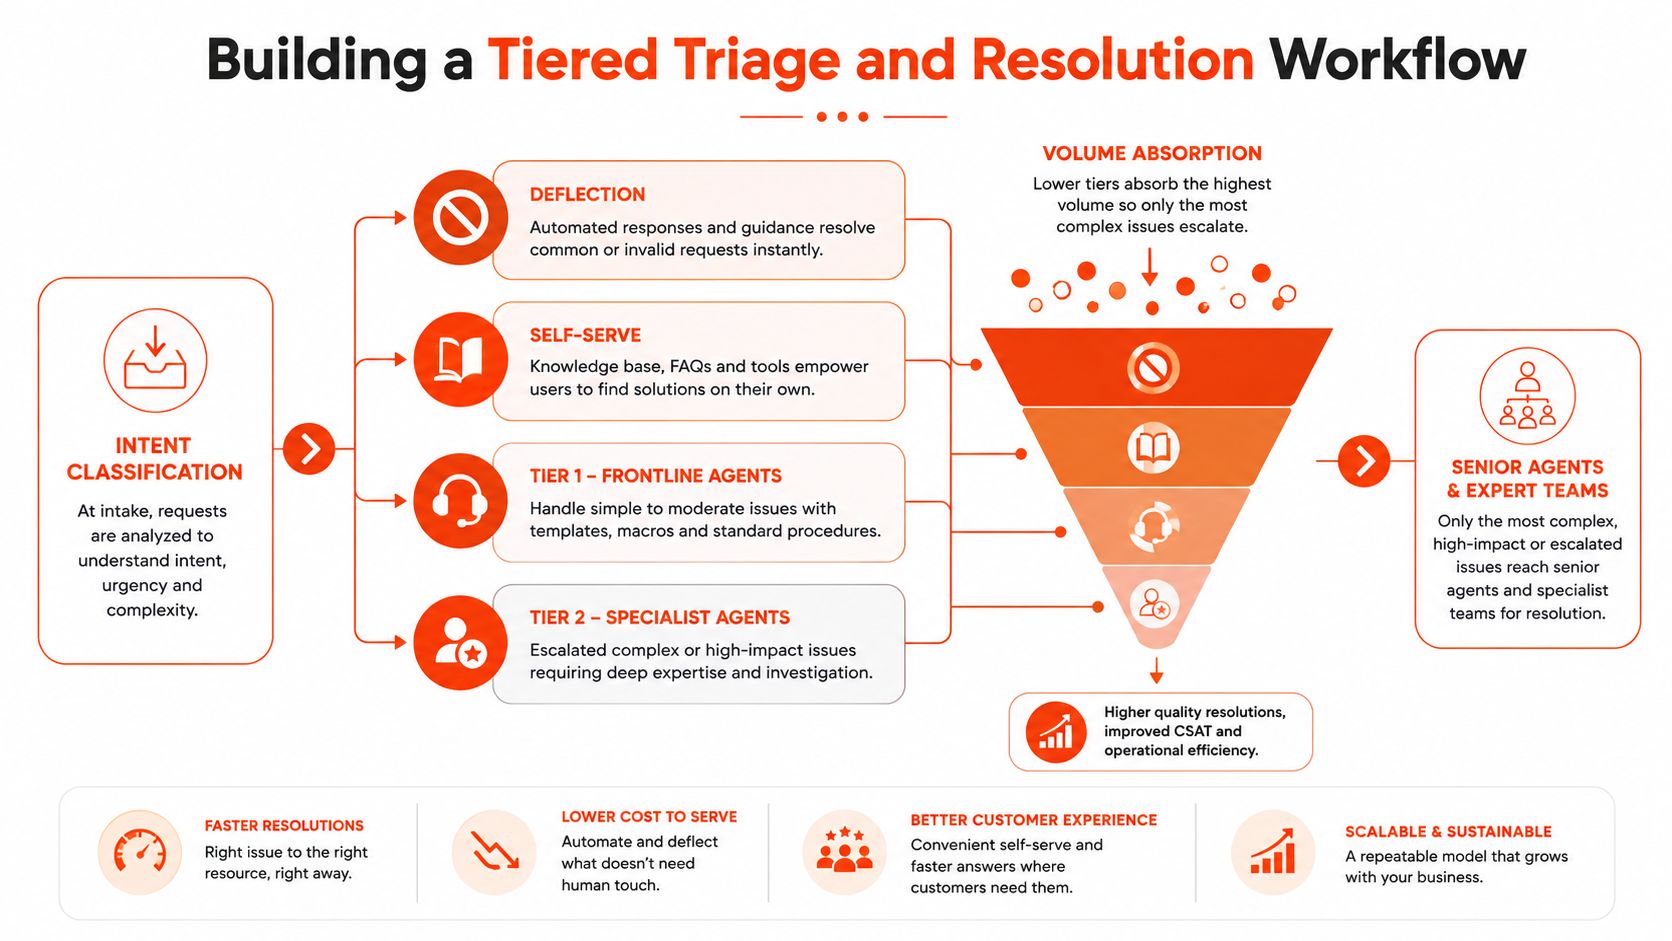
Before adding capacity, count how many Tier 1 contacts should have been Tier 0. Every one of those is a self-service gap, a docs gap or a product gap wearing a ticket costume. That is the cheapest capacity you will ever add.
Pull the top ten contact reasons and ask three questions of each: could the customer have resolved this alone, could Tier 1 have resolved it with better documentation, and did it recur after being closed? Then fix the top three. Rewriting the whole workflow annually is theatre; fixing the top three reasons quarterly compounds.
Most QA programs produce scores nobody uses. A useful one produces a change.
If more than half your findings are knowledge or process gaps, the problem is your documentation, not your people. That is also the tell that turnover is doing the damage: a stable team papers over weak documentation, and a churning one exposes it. For the service standards underneath the rubric, see the golden rules of customer service.
HDI's 2026 service management trends coverage describes the realistic near-term split: AI takes basic triage, password resets and navigation questions, while the harder work stays human. That is a qualitative read rather than a projection, and it matches what we see in practice.
| Give to AI | Keep with people |
|---|---|
| Deflection at Tier 0: status, policy, resets, FAQs | Anything involving money, contracts or an apology |
| Drafting first-pass replies for agent review | Judgment calls and exceptions |
| Summarizing long threads before escalation | Conversations with a strategic or at-risk account |
| Routing and categorization | Deciding when a rule should change |
| Surfacing similar past tickets | Anything a customer would be upset to learn was automated |
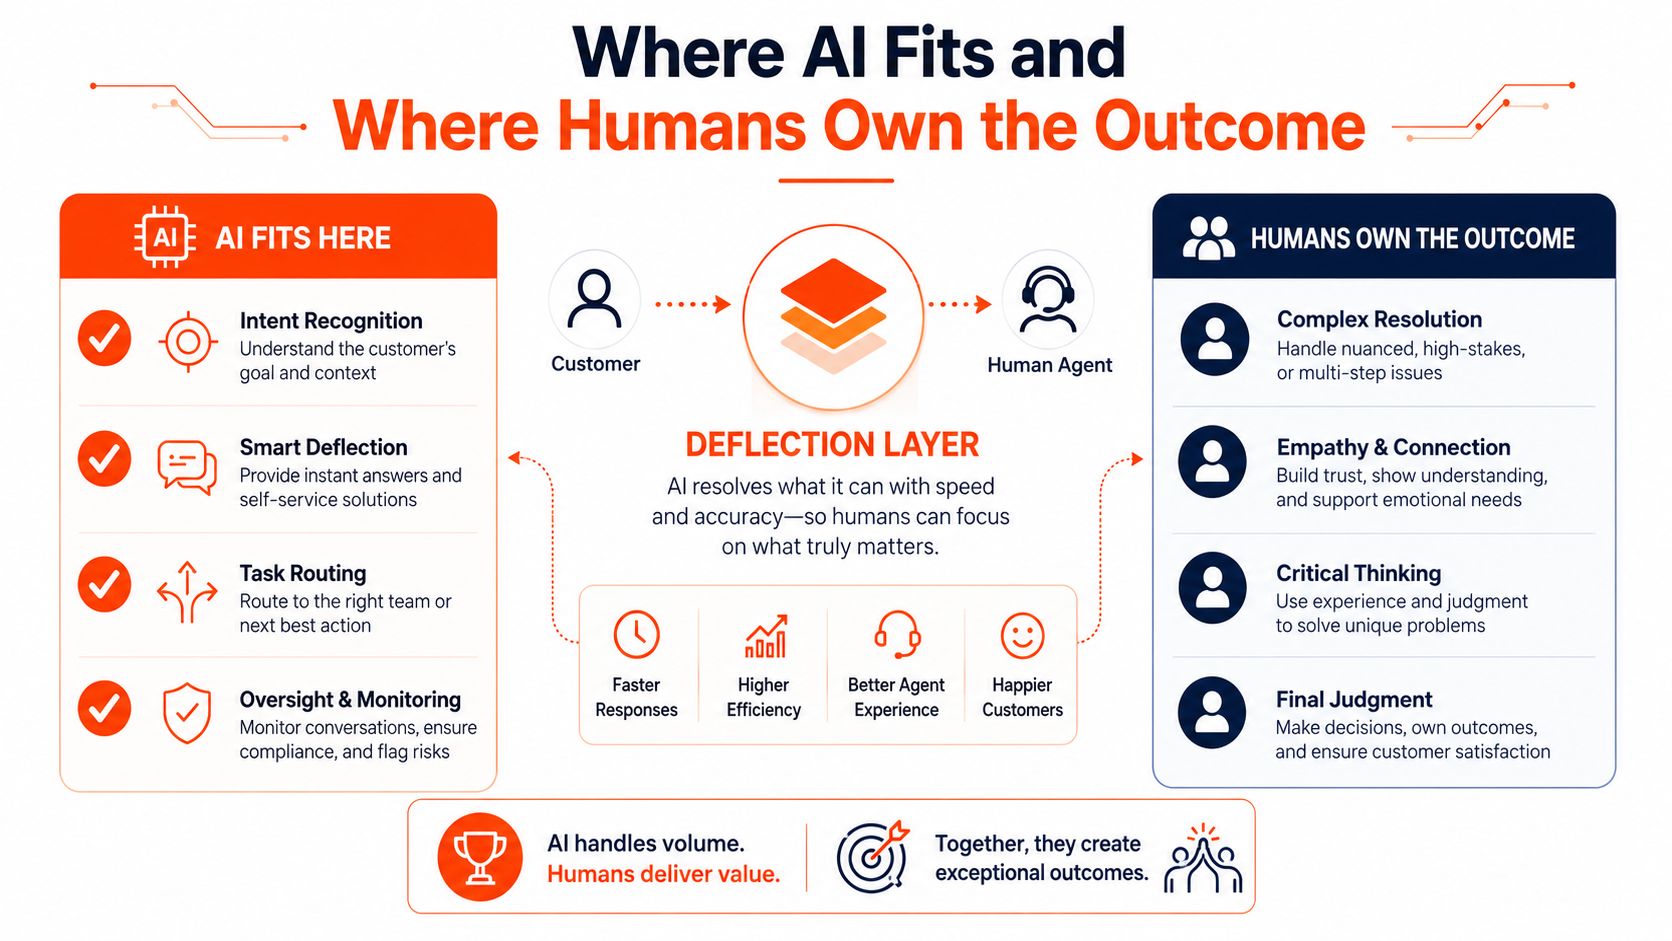
The buying decision that most often comes up here is the front door. For voice specifically, start by comparing AI receptionists with answering services, then test the choice against your actual intent mix and escalation risk rather than a demo.
If AI takes the simple contacts, every remaining human contact is harder than the average was before. That changes hiring, training, handle-time expectations and pay bands. Teams that deploy the tool without redesigning the role report the same thing: deflection went up and agent satisfaction went down.
Verification is the non-negotiable. Whatever AI drafts or resolves, someone must be accountable for a sample of it. Automation without a QA sample is not efficiency, it is an unmeasured risk.
The staffing model is where the continuity problem is either solved or made permanent. Three ways to do it, with different failure modes.
| Model | Continuity | Control | Fit |
|---|---|---|---|
| In-house U.S. team | You own attrition and the bench directly | Highest | Complex, regulated or brand-critical service |
| BPO or shared pool | Provider absorbs attrition, but agents rotate across clients | Low, you buy an SLA rather than a team | High-volume, standardized contact types |
| Dedicated nearshore professionals | Named people on your queue, with an agency replacement process behind them | You direct the work daily | Judgment-heavy service where product knowledge compounds |
Country selection matters for a live-service function, and the arithmetic here is public record rather than anybody's proprietary insight. Colombia, Peru, Panama and mainland Ecuador sit at UTC−5 and do not observe daylight saving time. That means they match U.S. Eastern exactly from early November to mid-March (EST, UTC−5) and run one hour behind it for the rest of the year (EDT, UTC−4) — so a 9-to-5 local day covers a 9-to-5 Eastern day almost end to end, year-round. Further south, Argentina and Brazil sit at UTC−3 and Chile at UTC−4 or UTC−3 depending on the season, which still leaves several hours of live overlap; Mexico City at UTC−6 lines up with U.S. Central. For a further comparison of how the region's zones line up against the U.S., see this Latin America time-zone alignment data.
Virtustant's candidate database includes 42,716 candidates who confirmed they can work U.S. business hours; this is a candidate-profile count, not a share of placements. Among the 397 distinct people with at least one placement start in H1 2026, current profile countries were Argentina for 92 people (23.17%), Brazil for 82 (20.65%), Colombia for 43 (10.83%) and Mexico for 30 (7.56%). Costa Rica accounted for 11 people (2.77%). A country label does not prove a person's working schedule: confirm coverage for the specific support queue.
H1 country-count source: Virtustant Sieve records retrieved 30 September 2026. Country shares use 397 distinct people with an H1 2026 placement start, including 30 people with no recorded country (7.56%). Country is the current profile field, not verified nationality or country at the start date. The cohort has no geography filter and includes 25 people with recorded countries outside Latin America. See the H1 2026 nearshore rate report for definitions.
Cross-border compliance is the part founders underestimate. Payroll tax obligations follow the worker's country of residence rather than the client's headquarters, including withholding, filing, reporting and remittance where the worker is based, according to cross-border payroll compliance guidance. Centralize contracts, payroll, HR records and compliance rather than asking an operations manager to improvise country-specific processes. That is exactly what how managed staffing works is for.
Related: customer service outsourcing costs by model, customer service outsourcing companies compared, outsource QA to Latin America and managing remote teams.
Virtustant is a remote staffing agency. We place named vetted professionals across Latin America who sit inside your service stack and your calendar, while we carry sourcing, assessment, contracts, payroll, HR and compliance. The queue, the rubric and the escalation rules stay yours.
| What we publish | Figure |
|---|---|
| All-in hourly rate, floor | $7.00 per hour |
| Placement, setup and recruitment fees | $0 |
| Typical full-time monthly cost | About $1,877 per month for 40 hours a week at the $10.83/hr customer service median client-side rate (Virtustant H1 2026, n=12) |
| Vetted bilingual candidates presented | 3 to 5 within 48 hours |
| Time to start | Start in 72 hours from your first call |
| Onboarding | Account manager coordinates onboarding, start date and tools access |
| Contract terms | Month to month, with a lifetime replacement guarantee and no time limit |
The replacement guarantee is the part that speaks directly to the 30% to 45% turnover problem: attrition becomes a defined process with a bench behind it rather than an unplanned outage in your queue. Against a comparable U.S. hire, you can save up to 70% once payroll, benefits and overhead are counted.
The vetting funnel behind our top 1% claim is published rather than asserted: of everyone who applies, 22% pass the initial screen, 9% pass the cognitive (IQ), skills and English assessment, 3% reach a live interview and 1% are hired. The 1% refers to that full multi-stage funnel. We have worked with more than 1,000 U.S. clients since 2021.
Start from the workflow, not the headcount. Once intake, triage and the rubric are written down, compare nearshore staffing for U.S. companies, the published rate card and the remote roles we staff. Our onboarding checklist covers the first 30 days. When you are ready to fill the seat, our guide on how to hire a remote support specialist turns coverage hours into a maximum hourly rate from your monthly budget, compares agency, EOR and freelancer routes, and lays out four vetting stages, the KPIs to track and a 30-60-90-day ramp.
Four stages: intake, triage, resolution and feedback. Intake captures and routes the contact, triage assigns tier and urgency against written rules, resolution does the work or escalates with full context, and feedback closes the loop into product, documentation and customer success. Most teams are strong at resolution and weak at intake and feedback, which is why the queue never shrinks.
Workforce continuity. Annual turnover in customer service roles runs 30% to 45%, and average tenure is 14.3 months in call centers and 13.7 months in customer support. A team that never reaches steady state has permanent onboarding, inconsistent answers, and process improvements that must be retaught to a partly new team every year.
FCR, first response time, backlog age, and escalation or recontact rate, with CSAT as a directional signal rather than a target. SQM Group puts the FCR benchmark average at 71%, a good rate at 70% to 79% and world-class at 80% or higher. Define what counts as a resolution before you measure it, since most FCR disputes are definition disputes.
Under a minute for chat and under an hour for email, per Kayako. Keep backlog under 5% older than seven days. Do not count an automated acknowledgement as a first response, and do not chase speed at the expense of resolution, because a fast wrong answer creates a second contact.
There is no single useful number, and Kayako declines to publish one for good reason: resolution time varies too much by issue type. A blended average mixes a two-minute password reset with a two-week billing dispute. Segment by issue category and set a target per category, or do not report the metric at all.
Define four tiers by rule, not by seniority. Tier 0 is self-service for resets, order status and policy questions. Tier 1 handles documented resolutions and account changes within limits. Tier 2 takes judgment calls, exceptions and technical diagnosis with a written goodwill limit. The owner keeps policy exceptions, refunds above the limit and anything with contractual exposure.
Sample deliberately across random, low-CSAT and escalated contacts. Score against a published rubric covering accuracy, completeness, tone, adherence to decision rules and correct escalation. Separate knowledge, process, tool and behavior defects, because each needs a different fix. If more than half your findings are knowledge or process gaps, the problem is documentation rather than people.
Tier 0 deflection such as order status, policy questions and password resets, plus drafting first-pass replies for agent review, summarizing threads before escalation, routing and surfacing similar past tickets. Keep anything involving money, contracts, an apology, a judgment call or an at-risk account with a person, and keep a QA sample on whatever AI resolves.
It depends on the model. A shared agent pool rotates people across clients, so product knowledge never compounds and you buy an SLA rather than a team. A dedicated model places named professionals on your queue with a replacement process behind them, which turns attrition into a defined handover rather than an unplanned gap.
Because a queue has to be covered while your customers are awake, and the offsets are a matter of public record. Colombia, Peru, Panama and mainland Ecuador sit at UTC-5 with no daylight saving, so they match U.S. Eastern exactly in winter and sit one hour behind it in summer, covering a 9-to-5 Eastern day almost end to end. Argentina and Brazil are at UTC-3, Chile at UTC-4 or UTC-3 by season, Mexico City at UTC-6. In our own base, 42,716 candidates have confirmed they can work U.S. business hours. Overlap is what lets escalations resolve the same day instead of the next morning.
Third-party figures are those each source publishes on its own site, checked September 2026. Time-zone offsets are public record from the IANA time zone database. Virtustant figures are first-party placement data.